Investigation of the Thermal Performance of Wall Systems with Significant Thermal Mass

Increasing the thermal performance of a wall system can reduce the energy consumption of buildings. This can be done in two ways: increasing the thermal resistance of the building envelope and increasing the thermal mass. Typically, energy codes have primarily focused on increasing energy efficiency by increasing the thermal resistance and have not given as much attention to the thermal mass due to the complex nature of transient heat transfer. By not accounting for the thermal mass in energy codes, the thermal performance of systems such as brick veneer can be significantly underpredicted depending on the local climate.
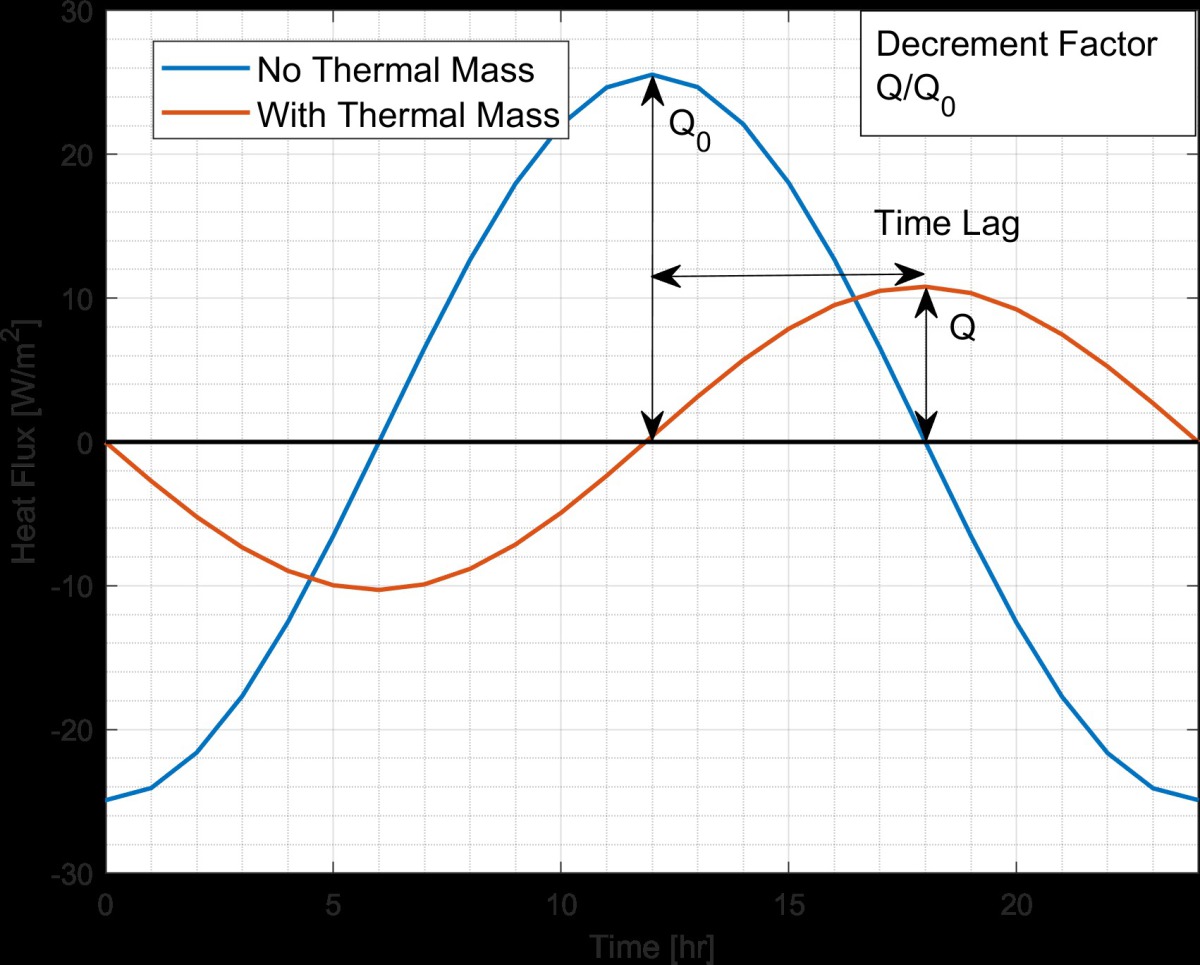
Building envelopes that contain thermal mass reduce heat transfer through them by acting as a thermal battery. Under favorable conditions, they absorb heat during the day, then release the heat during the night. If the thermal capacity of the system is large enough, heat will be preferentially stored rather than transmitted through the material. The thermal mass of a material is given by its volumetric heat capacity and the total heat storage of a wall system is the product of the volumetric heat capacity and the thickness of the component (assuming one dimensional heat transfer perpendicular to the wall assembly). The effect of thermal mass on the heat transport is shown in »1. The total energy usage of a wall system is given by the area under the curve in »1. Adding thermal mass results in a reduced energy transfer and delay in when the peak energy usage occurs. Delaying peak energy is also beneficial as it does not occur during peak electricity demand.
Ceramic materials such as fired clay bricks are a common component in many types of construction. Fired clay brick are typically chosen for ascetics and durability. In the United States, clay brick are not traditionally seen as a material that can increase energy efficiency. Literature on the thermal properties of commercially produced fired clay brick is either on brick of European origin or is out of date for brick produced in the United States today. In order to understand the energy usage of building envelopes, the thermal properties of all the components must be known. Fired clay brick in the literature have bulk densities ranging from 1600 – 1900 kg/m3 and thermal conductivities from 0.3 – 0.65 W/mK. These densities are significantly below those of commercially produced brick in the United States today, and as a result, the thermal conductivities will be different.
In order to sample as wide a variety of thermal properties as possible, commercially produced brick were obtained from five different manufacturers to sample different types of raw materials. The commercially produced brick that were selected for this study are reported in »Table 1. The thermal conductivity of the fired brick was measured using a small-scale hot box apparatus1. The fired brick were also characterized using x-ray fluorescence, x-ray diffraction, mercury porosimetery, optical microscopy, ASTM C67 water absorption, and ASTM C67 compressive strength. The goal was to determine how the thermal properties of the fired clay brick were impacted by the composition and microstructure.
Four of the commercially produced fired brick had bulk density values significantly higher than those reported in literature and had correspondingly higher thermal conductivity values. The other sample, labeled Plant 4, was produced with a pore-forming agent, and had a lower bulk density value. Interestingly however, it did not have the lowest thermal conductivity, and actually had a thermal conductivity higher than those reported in the literature. One of the commonly observed trends in the literature is that the thermal conductivity increases with increasing bulk density, but there is a lot of scatter in the relationship. The origin of this scatter is due to differing phase composition, firing conditions, and microstructure2.
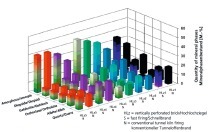
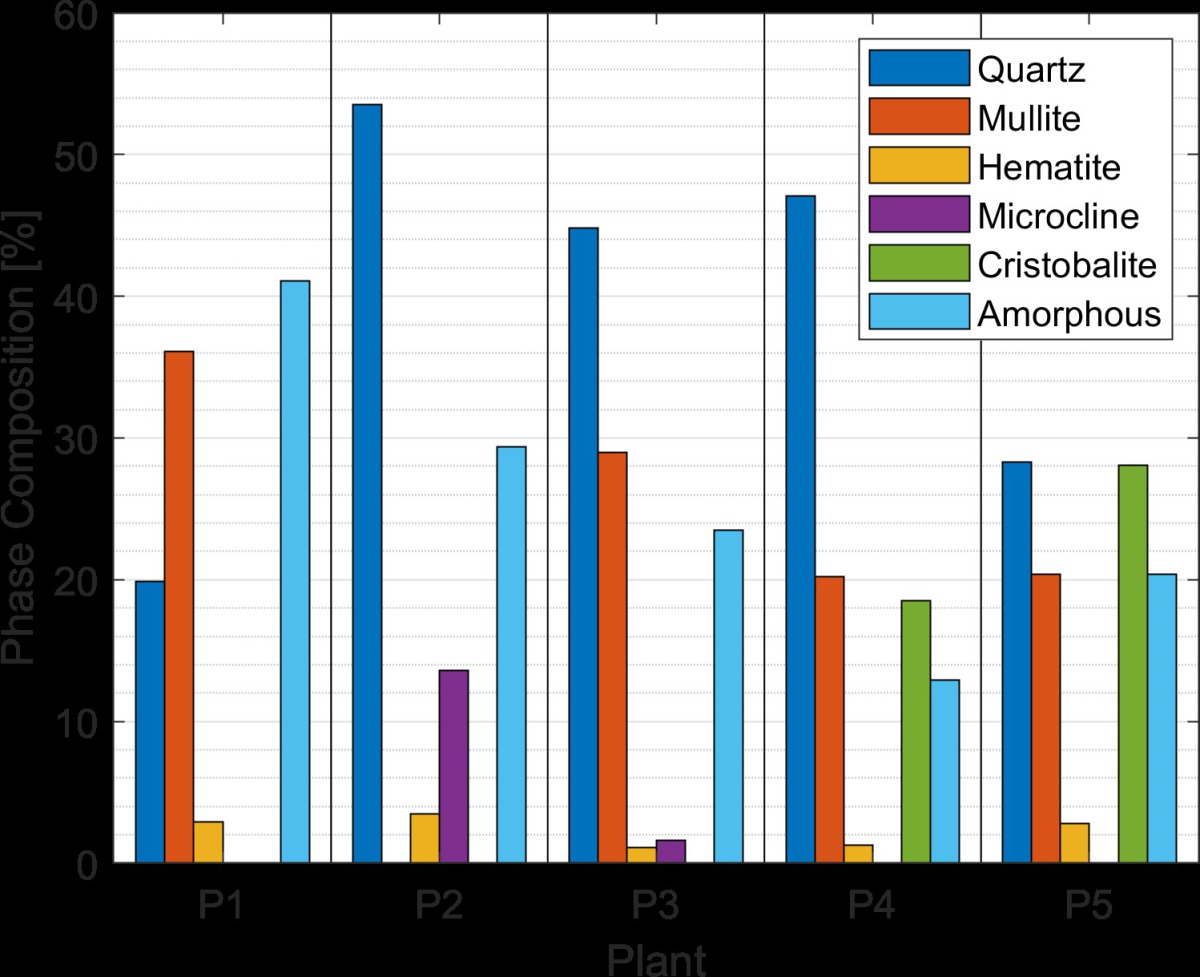
In addition to the physical properties being significantly different from each other, the commercial brick also had very different phase compositions. The XRD results are reported in »2. The fired brick had a wide range in phase composition. The common phases among the five fired brick were quartz, hematite, and an amorphous or glassy phase. Other than the brick from plant two, they also contained significant quantities of mullite. The quartz content among the commercial samples varied from 20-55 %, the mullite concentration varied from 0-36 %, and the amorphous content varied from 12-40 %. These wide ranges in phase composition had a significant impact on the thermal conductivity of the samples which was determined using lab fired samples.
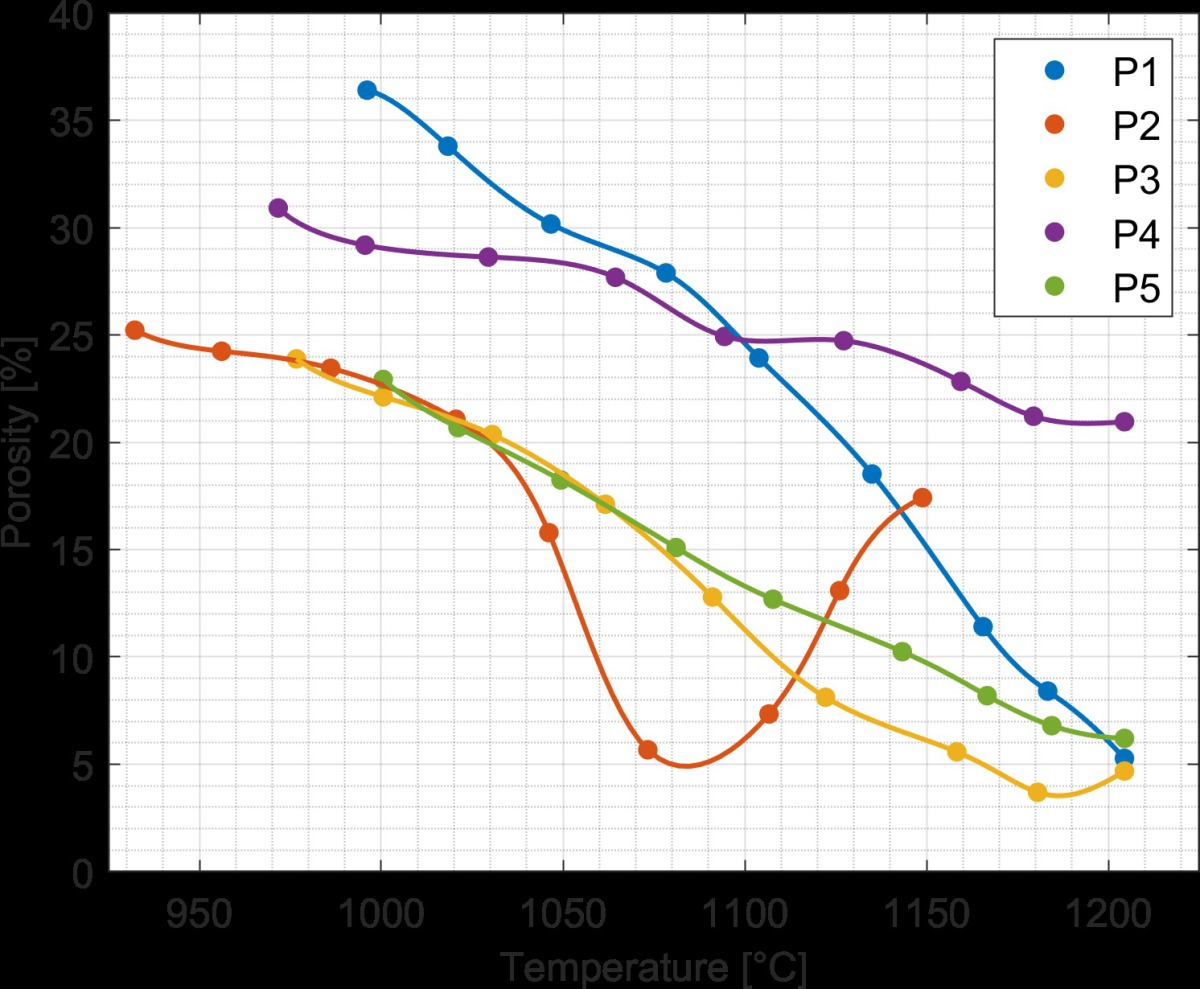
After characterizing the commercially produced brick, gradient firing was carried out to determine firing temperatures for additional study for each type of brick. To get a wider range of properties, the green brick were intentionally under- and over-fired to significantly change the porosity of the final product. The results of gradient firing green brick from each plant are shown in »3.
The sintering behavior of the brick from each plant was different due to the different raw materials. The red brick from plant 2 contained a feldspar impurity resulting in a lower firing temperature. The material from plant 4 that had the pore-forming agent was found to only moderately change its porosity with firing temperature and never fully densify. This was because the pores generated by decomposition of the pore-forming agent were sufficiently large that they did not close off at an appreciable rate.
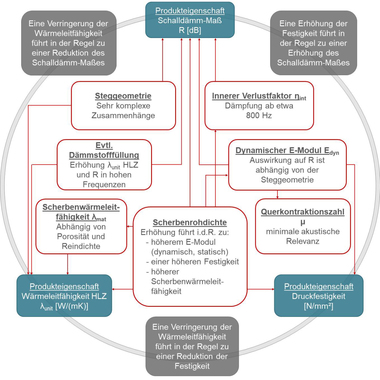
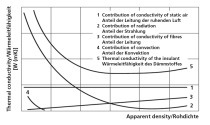
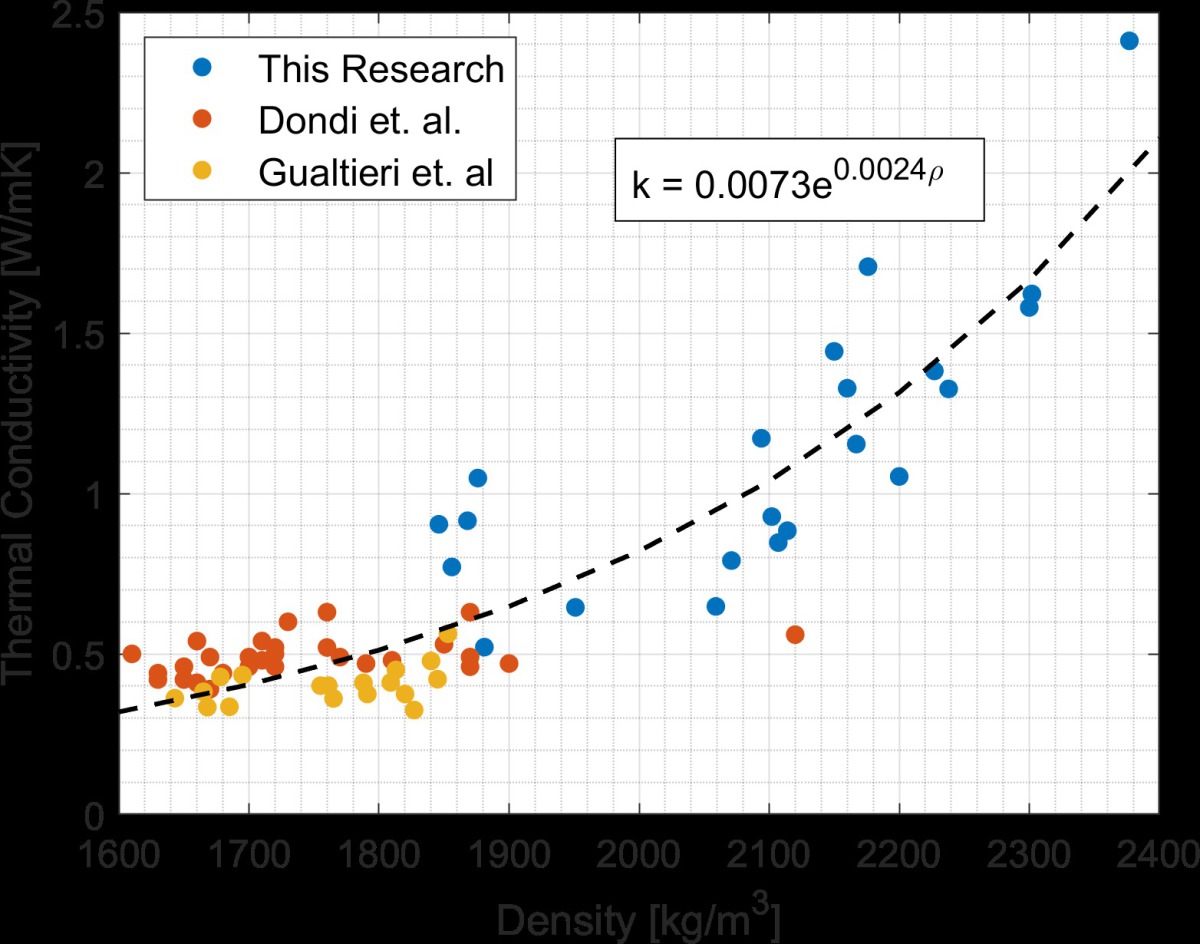
The thermal conductivity of the lab fired brick were found to vary significantly both between groups, as well as within a single group. This was attributed to changes in porosity, phase composition, and microstructure of the fired material. The thermal conductivity values measured in this study were found to cover a significantly wider range of values than those reported in literature2,3. This is shown in »4. The bulk density values for the fired brick in this study were above those previously measured in literature, and the thermal conductivities were subsequently higher. By expanding the range of measured thermal conductivities, a non-linear trend was observed with bulk density, when this data was combined with existing literature. A similar non-linear trend has been shown for concrete in the literature4.
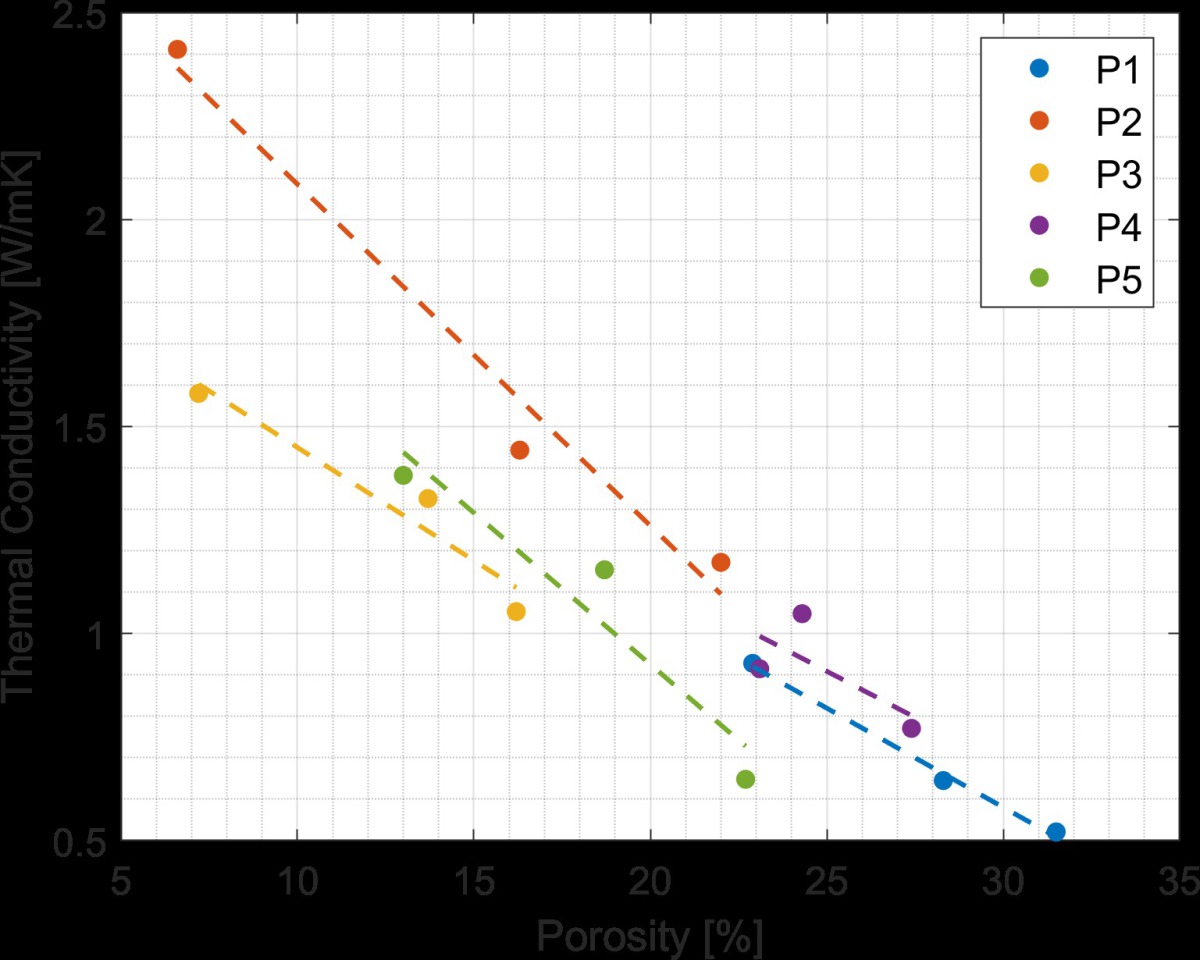
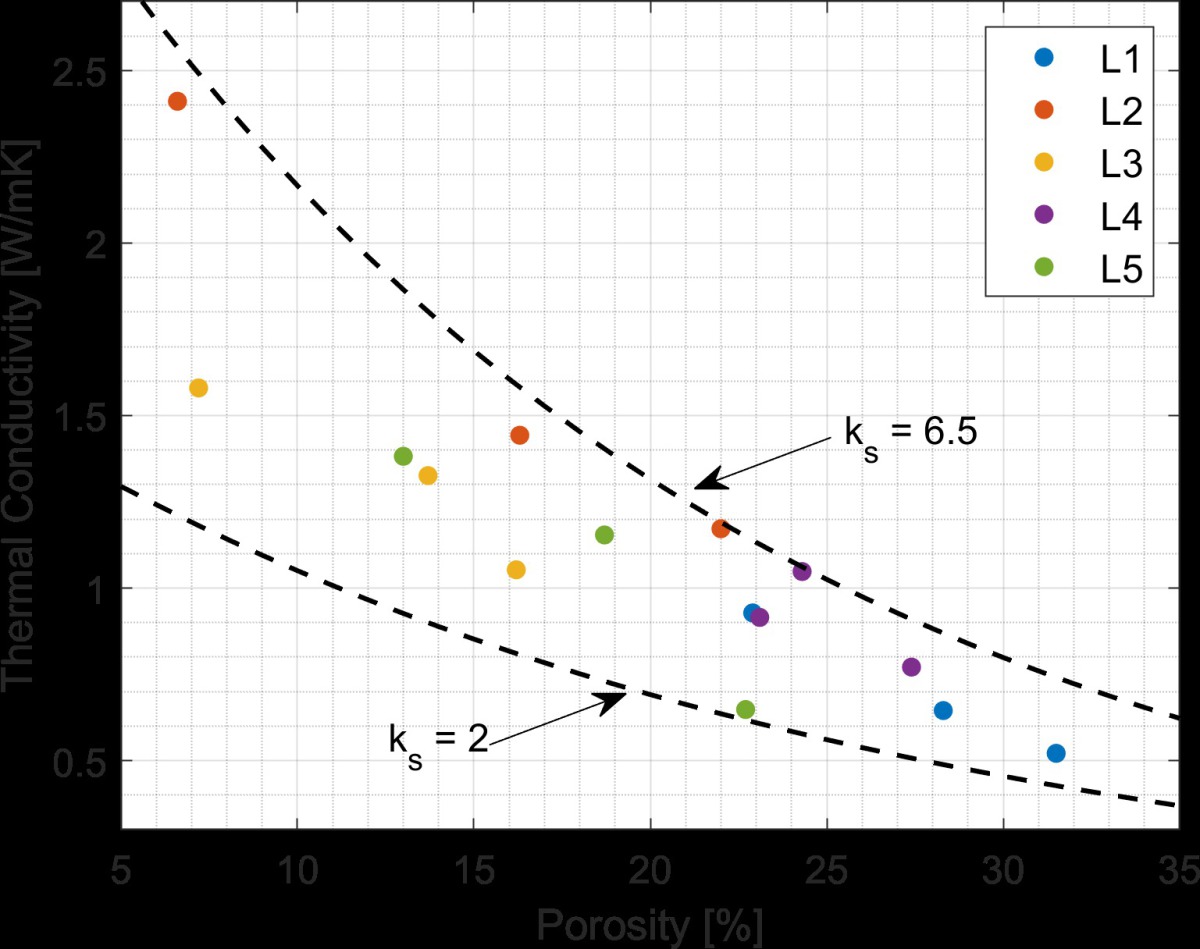
Although the bulk density is compared to the thermal conductivity in »4, it is the porosity that is responsible for reducing the thermal conductivity. The air trapped within the pores has a thermal conductivity significantly lower than the surrounding solid material and results in a lower overall thermal conductivity. For each raw material, increasing the firing temperature resulted in a linear decrease in the porosity of the material. The thermal conductivity was found to increase with firing temperature due the reduction in porosity. The relationship between porosity and thermal conductivity is shown in »5.
For a single group, there was found to be a linear reduction in thermal conductivity with increasing porosity. Importantly, the slope of the trendline was found to be almost equal across all five groups implying that the effect of porosity on the thermal conductivity of the final part was independent of the composition of the solid phase. This was important because it allowed for predicting the thermal conductivity if the thermal conductivity of the solid phase was known.
The difference between the thermal conductivity of the five groups shown in »5 was related to the phase composition and microstructure of the samples. Those materials that contained high thermal conductivity phases such as quartz and low amounts of amorphous phase had solid phase thermal conductivities that were higher than those materials that had a significant amount of amorphous phase. This is because quartz has a thermal conductivity of approximately 7.7 W/mK, while the amorphous phase has a thermal conductivity of approximately 1.4 W/mK. The solid phase thermal conductivity was estimated by taking the geometric mean of the thermal conductivities of each constituent phase. This was calculated using equation 1:
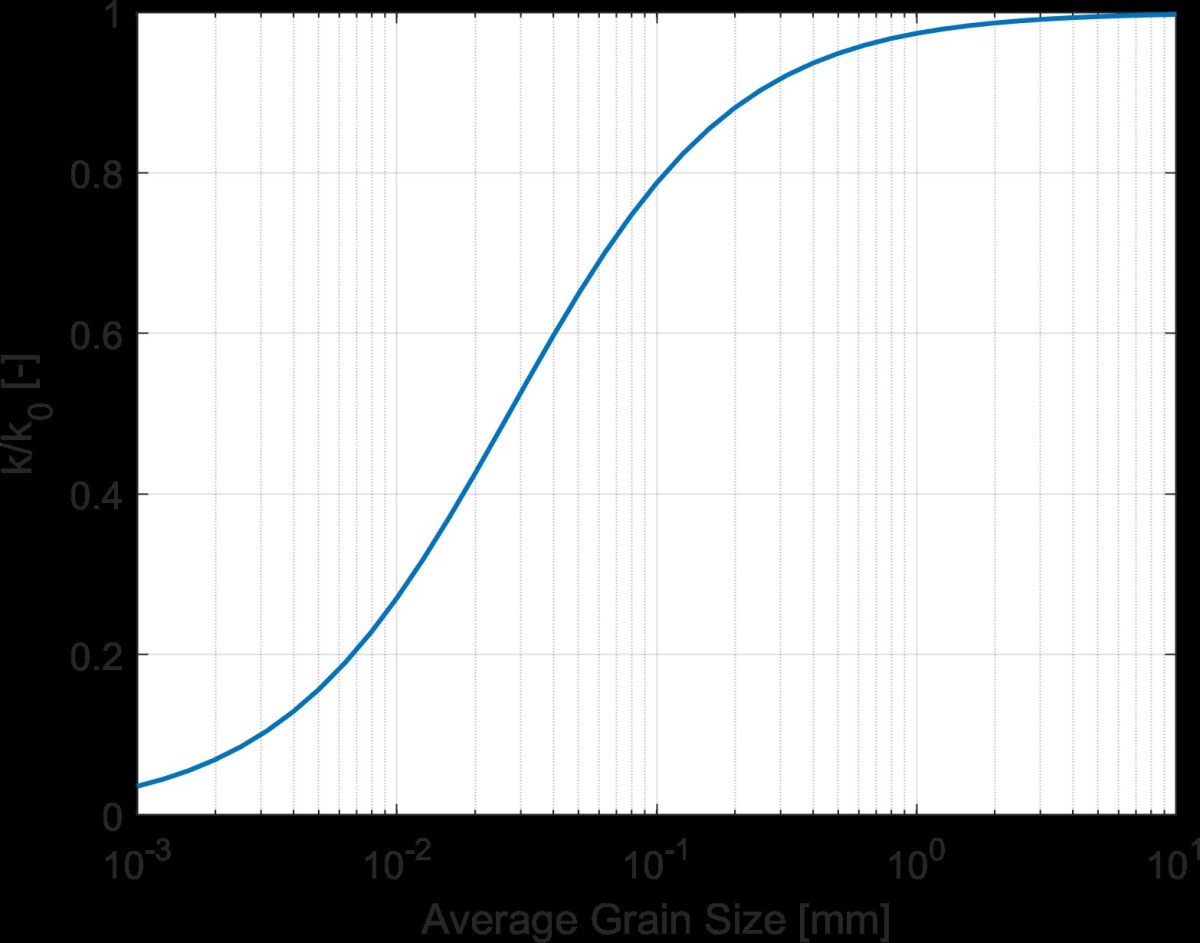
Where ki is the thermal conductivity, and ci is the concentration of the constituent phase. The concentration of each phase was measuring using X-Ray diffraction. Using Equation 1 however, lead to significant mismatch between the measured and calculated solid phase thermal conductivity. The reason for the mismatch was that the microstructural effects were not accounted for in the calculation. The important microstructural feature in relation to the thermal conductivity was the grain size. The presence of grain boundaries within the material serve to lower the effective thermal conductivity of the solid phase due to interfacial resistance that is present at the boundaries5. The smaller the grain size of the material, the more grain boundaries that are present, and the lower the effective thermal conductivity of the material. The impact of the grain boundaries is given in »6. The equation for this grain boundary correction is given in Equation 2:
Where ks is the solid phase thermal conductivity, a is the grain size, hc is the grain boundary conductance (reciprocal of the grain boundary resistance), and keff is the corrected effective solid phase thermal conductivity. From »5, materials with a grain size of approximately 10μm will have a reduction in solid thermal conductivity by almost two-thirds. This implies that the interfacial resistance within the material is a significant portion of the overall thermal resistance.
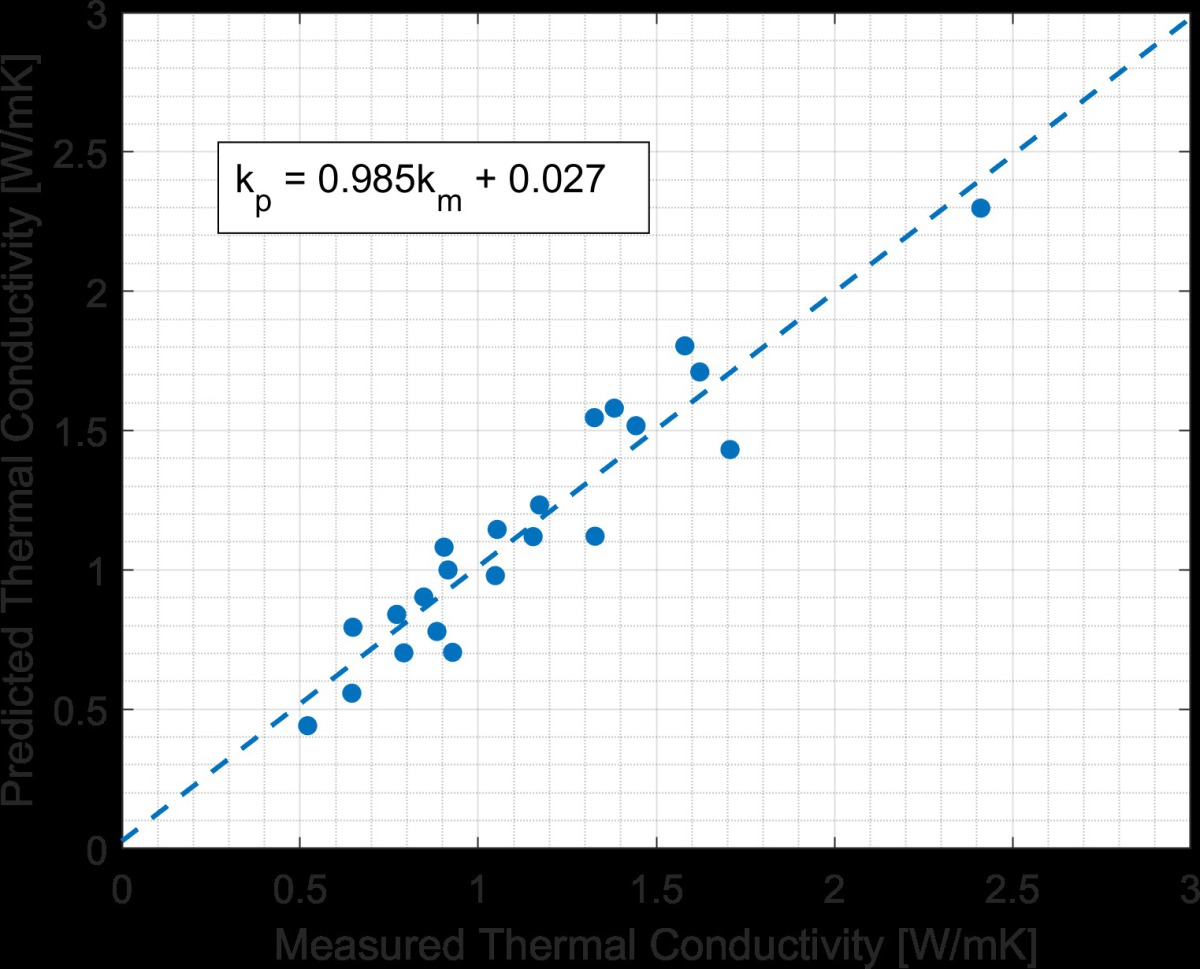
From Equation 2, the important value is the non-dimensional parameter ks/ahc. This parameter relates the number of grain boundaries (1/a), the grain boundary resistance (1/hc), and the thermal conductivity of the solid phase together. The value of the grain boundary conductance (hc) was taken to be 1.3∙106 W/m2K. To determine if the spread in thermal conductivities among the different groups could be explained by this correction, different values of ks were chosen given a fixed grain size. The results of this are shown in »7. The grain size used for this calculation was 6μm, determined by optical microscopy. The geometric mean model was used here to calculate the effective thermal conductivity given the properties of the solid and air phases. If the grain boundary correction was not applied, the upper curve would correspond to a solid phase thermal conductivity of only 3.5 W/mK, which is significantly lower than the estimated solid phase thermal conductivity of the fired brick using Equation 1. The calculated thermal solid phase thermal conductivity using Equation 1 agrees with the experimental data when the grain boundary correction is factored in. By account for the changing phase composition of the material, the grain size, and the porosity of the material, the thermal conductivity could be predicted with reasonable accuracy. The comparison between predicted and measured thermal conductivity is shown in »8 for all of the samples evaluated in this study.
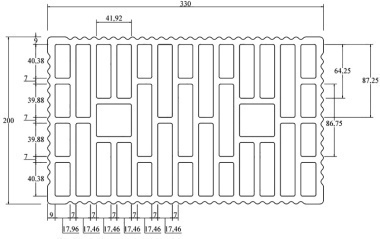
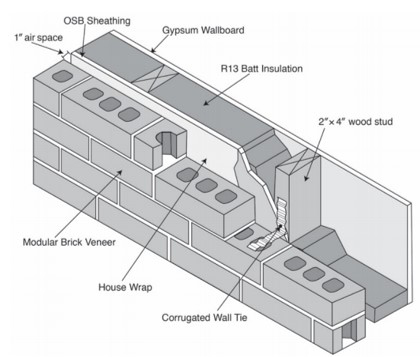
Wall assemblies, however, are made from more than just fired brick. Residential and commercial brick veneer construction in the United States typically has either a wood- or steel-framed wall behind the brick veneer. This stud wall adds additional thermal resistance, but little thermal mass. A schematic of a typical residential brick veneer wall system is given in »9. In order to test the thermal performance of a wall system, a modified hot box apparatus was constructed to measure the steady-state and dynamic thermal performance of these wall systems. This hot box apparatus utilized multiple heat flux transducers to measure the heat flux through the wall assembly instead of relying on measuring the energy input to the box itself. In this way, the transient response of the box could be eliminated from the measurement. This hot box apparatus is similar to that described in EN 1934:1998-036. The hot box apparatus was calibrated against a heat flow meter apparatus to ensure that the heat flux transducers were not affecting the measurement of the wall assembly.
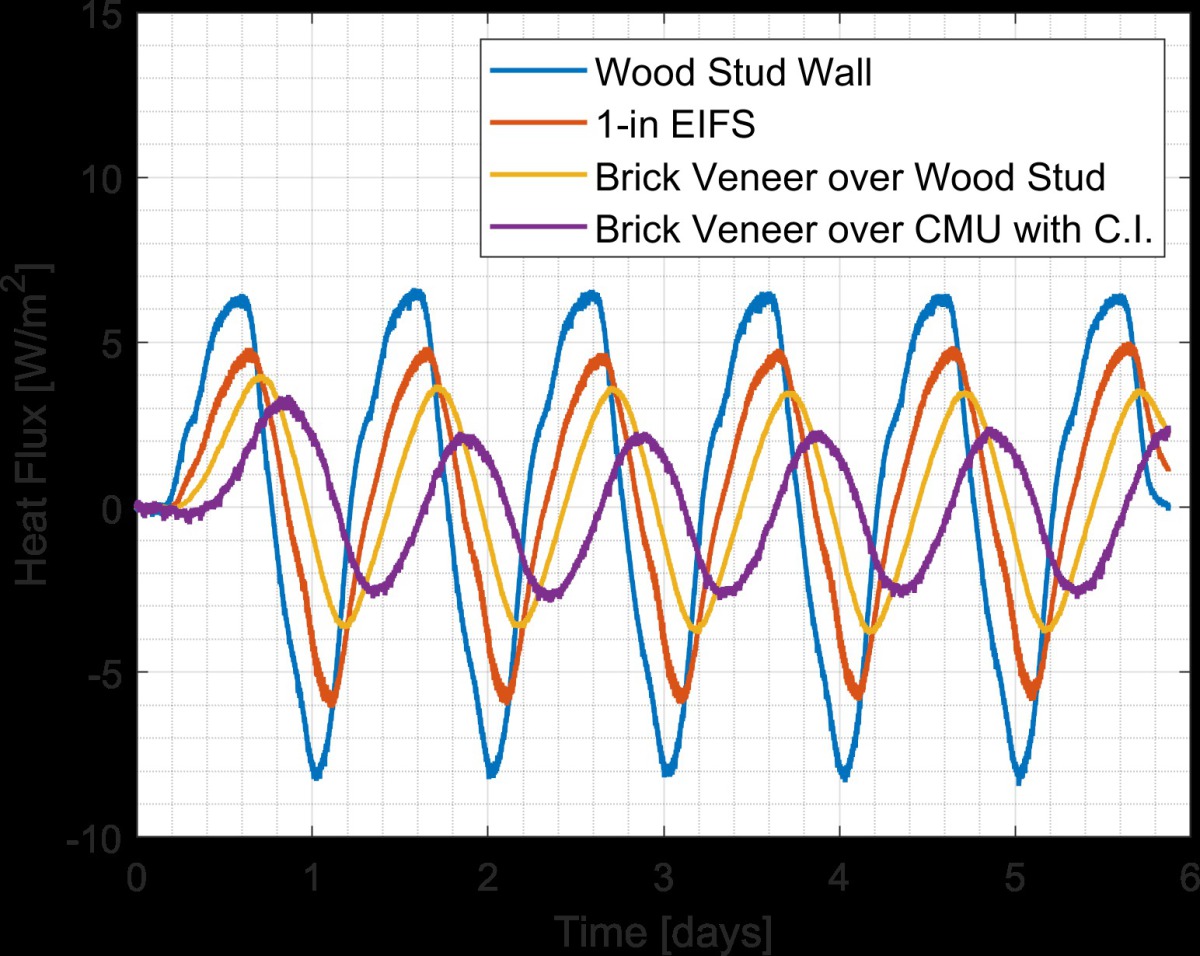
Every wall system was tested at four different steady-state conditions to determine the temperature-dependence of the thermal resistance of each system. Following this, five days of dynamic testing were performed wherein a simulated day-night cycle was applied to the exterior of the wall system. This “Sol-Air” cycle mimics the effect of solar radiation and dynamic air temperature as would be experience by a wall system outside7. The large applied temperature swing allowed for the thermal mass benefit to be quantified under a standard temperature cycle. The dynamic performance was quantified by measuring the total heat transfer on the interior of the wall surface. Walls with differing amounts of thermal resistance and thermal displayed a markedly different response to the applied cycle. The more thermal resistance and thermal mass a wall system had, the smaller the heat transfer to the interior of the wall system. These results are shown graphically in »10. In addition to the smaller overall heat transfer, the time at which the peak energy occurred, known as time lag, was also significantly greater for walls with more thermal mass.
The addition of brick veneer over a residential wood-stud wall resulted in an increase in thermal resistance of approximately 13 % under steady-state conditions while reducing the dynamic heat transfer by 50 %. The reduction in energy transfer under the dynamic temperature cycle shows the benefit that can be obtained when thermal mass in included in the wall assembly. This thermal mass benefit however, is difficult to predict due to the complex interaction between the environment and the components of the wall system. The cycle applied in the hot box apparatus accentuates the effect of thermal mass. Under realistic conditions however, there are periods of time where the wall system is under conditions where the steady-state performance is more accurate and also times where the thermal mass benefit is large. Realistic performance will fall somewhere in between a comparison of steady-state and dynamic results from the hot box tests.
In order to determine more accurately how wall systems respond to real-world conditions, a custom finite element program was developed that utilizes measured climate data to model the performance of the wall system under those conditions. This model was verified against ANSYS for numerical accuracy as well as steady-state and dynamic hot box tests for experimental accuracy. Being able to simulate the wall systems allows for determining how much of the thermal performance of a wall system is contributed to the thermal mass. For the residential brick veneer wall shown in »9, the thermal mass alone reduces the energy transfer by up to 54.5 %. If the brick veneer is removed, the thermal mass of the stud-wall accounts for a 10.7 % reduction in energy transfer. Although the stud wall does not have much thermal mass in comparison to brick veneer, its placement one the interior of the wall assembly means it has a larger relative impact on the heat transfer.
Modeling the residential brick veneer wall assembly using climate data for Atlanta, GA yields some interesting results. Firstly, the direction the wall is facing has a significant impact on the yearly heat transfer. A south-facing brick veneer wall has the lowest energy usage despite the additional thermal load from the sun. This is in contrast to a lightweight wall system where the highest energy usage is on the south-facing side. The thermal mass of the system allows the system to absorb the solar radiation and reduce the energy loss during the night hours.
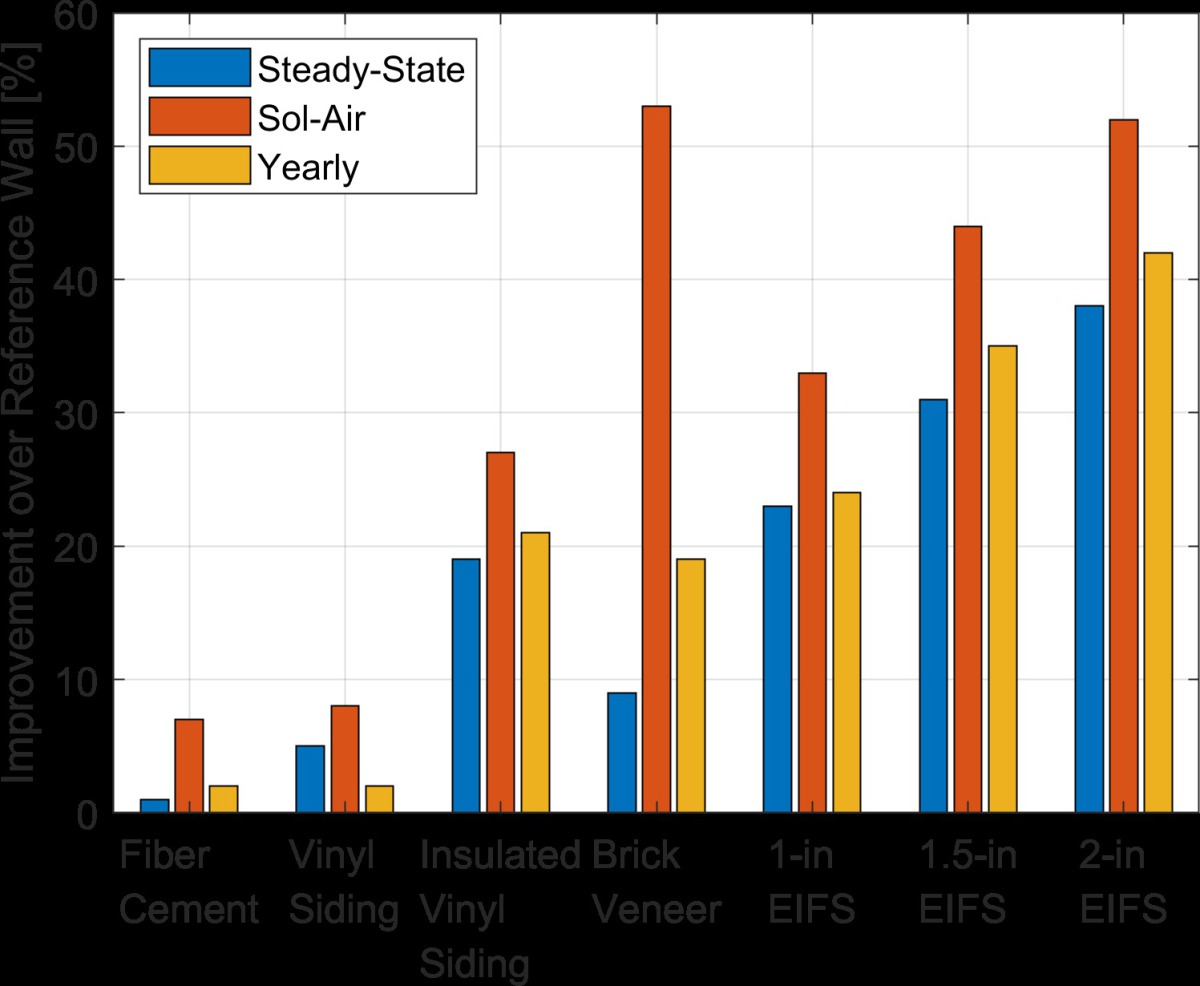
The goal of hot box testing different wall systems was to quantify the impact that different exterior claddings had on the overall energy usage of the wall system. The hot box allowed for determining the steady-state and dynamic performance changes caused by the cladding. The inclusion of the modeling tool allows for an estimated real world comparison of the impact of the cladding on the performance of the system. These results are shown in »11. As expected, in most cases, the steady-state comparison gives the lowest improvement over the reference wall and the dynamic (“Sol-Air”) results give the best case impact of the thermal mass on the improvement. The estimated yearly impact of the cladding lies somewhere between the two, with systems in favorable climates and thermal mass moving more towards the dynamic performance improvement metric.
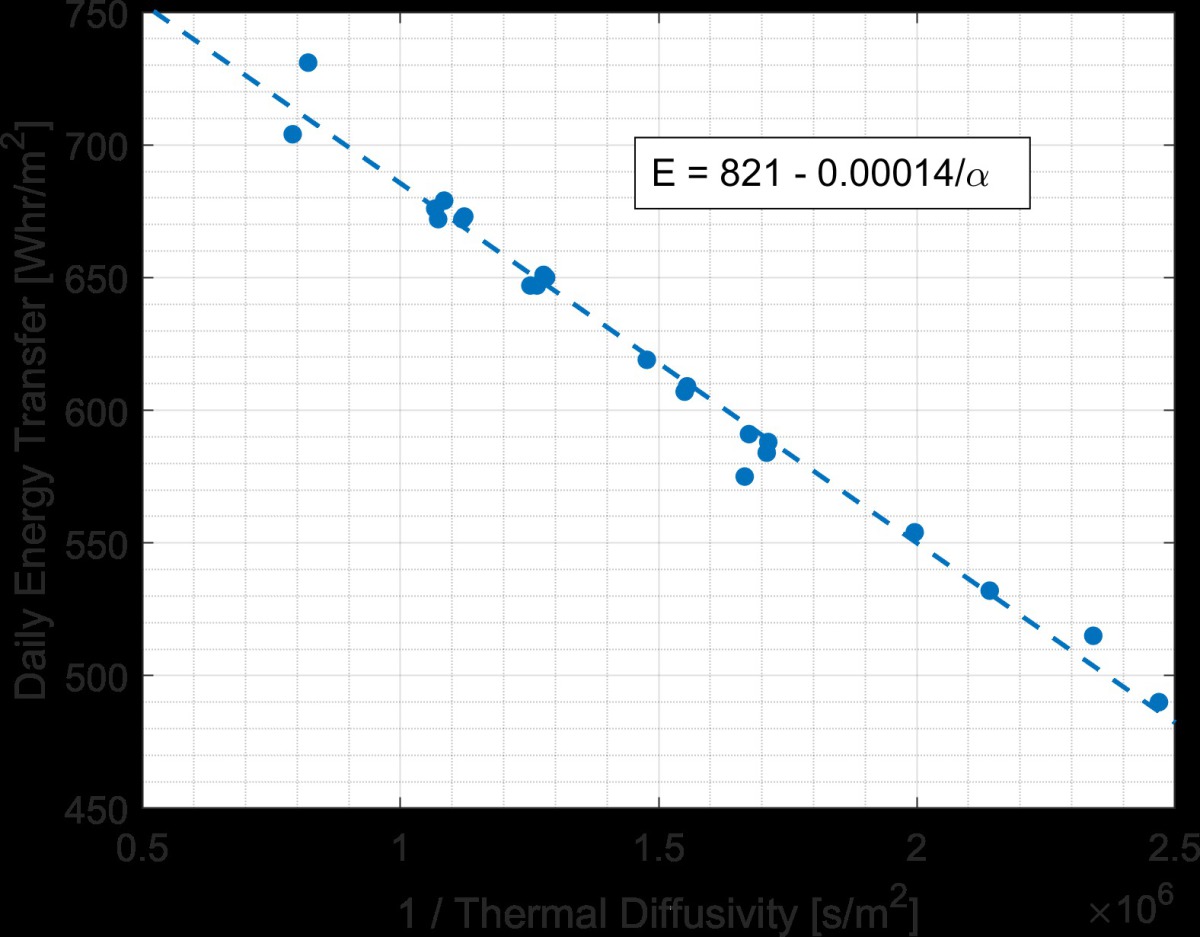
The final goal of this research was to understand how to optimize the performance of the brick veneer wall system. Specifically, how the material properties of the brick veneer impact the energy usage of the wall system as a whole. Utilizing the finite element program, coupled with the thermal properties measured for fired brick, two types of walls were simulated under the same dynamic cycle used for hot box testing. The first was the brick veneer by itself as a single component; the second being the residential brick veneer wall assembly. The impact of the material properties on the energy transfer was studied. It was found that for the wall just made of brick, the only parameter that impacted the energy usage was the thermal diffusivity. This is shown in »12. The energy transfer scaled linearly with the reciprocal of the thermal diffusivity. For the residential brick veneer wall in »9 however, the impact of the thermal properties of the brick on the system’s performance was more complex. This was due to the interaction between the different layers and placement of the mass becoming important. Nevertheless, it was possible to determine how the brick impacted the system as a whole. The relationship is given in Equation 3:
Where α is the thermal diffusivity and ε is the thermal effusivity of the fired brick. The appearance of an additional parameter here was somewhat surprising, but makes sense. The thermal effusivity is a common metric when discussing phase change materials and it related a materials ability to store heat rather than exchange it with its surroundings. The best performing wall system would be those that are able to store a large amount of heat during the daytime hours, but not transport it to the stud wall behind the brick veneer. The measured thermal properties of fired brick in this study were able to change the dynamic thermal performance of a residential brick veneer wall by approximately 30 %.
In addition to the material properties being optimized for fired brick, the geometry of the unit itself should be optimized for the local climate. This includes optimizing coring pattern and potentially inclusion of insulating within the unit itself. Research is currently planned to address unit configuration impact on thermal performance. Additional research is currently being done to measure and characterize the solar reflectance of fired brick as solar radiation (both visible and infrared) represent a significant heat load on a wall system and this value should be studied to determine how it impacts the energy usage.