Influence of brick flour or concrete rubble on the setting behaviour of fly-ash-based geopolymers
Abstract
In the presented work, the influence of increasing brick flour and concrete rubble additions on the setting behaviour and material properties of fly ash-based geopolymers is investigated. The geopolymers produced are tested for their compressive strengths, bulk densities and thermal conductivities, among other things. In order to be able to put the material-technical parameters in a meaningful relation to the setting behaviour and the structures that form, both the starting materials and the resulting binders are examined by means of infrared spectroscopy, X-ray diffraction analysis and scanning electron microscopy. The investigations showed that both broken bricks and concrete rubble are well suited as matrix-forming raw materials for geopolymer production. At the same time, different material properties could be determined and attributed to different setting and strength-forming mechanisms. (The influence of brick flour or concrete rubble on the mechanical properties of fly ash geopolymers was analysed in a first article in ZI 01/2023.)
3.2. Structural analyses
3.2.1. IR Spectroscopy
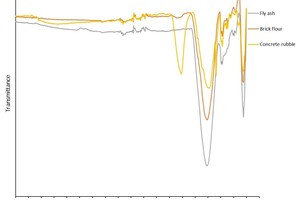
IR spectroscopy is a standard analysis method used to make the structures of geopolymers visible [1]. To this end, the IR spectra of the starting materials fly ash, brick flour and concrete rubble (» Figure 5) were captured and compared with the IR spectra of the geopolymers batches produced from them (» Figures 6 and 7). The IR spectrum of the fly ash shows transmission bands at wave numbers 3120, 1016, 776 und 447 cm-1. The peaks at 1016 and 447 cm-1 are the main bands of the Si-O- and Al-O bonds, as shown similarly by Bohra [2]. In the unreacted fly ash, the asymmetrical oscillation bands at 1016 cm-1 and the symmetrical oscillation bands at 776 cm-1 are attributed to the presence of quartz. The signal between 560 and 550 cm-1 indicates octahedral aluminium of the mullite [3]. The IR spectrum of the brick flour shows transmission bands at 1454, 1012, 777, 693, 569 and 448 cm-1. Here, too, the main bands are established at similar wave numbers as the fly ash used, namely at 1012 and 448 cm-1. Here, too, these are the Si-O and Al-O bonds [4].
The IR spectrum of the concrete rubble shows transmission bands at the wave numbers 3340, 1415, 987, 874, 777, 712 and 448 cm-1. Here, too, the main bands of the Si-O and Al-O bonds are in a similar range as in the fly ash used and the brick flour, at around 987 and 448 cm-1, as also described by Frost and Horgnies [5, 6]. In addition, the spectrum of the concrete rubble, has a main band at 1415 cm-1, which agrees with the asymmetrical oscillation bands of the O-C-O bonds of the calcium carbonates [7–10].
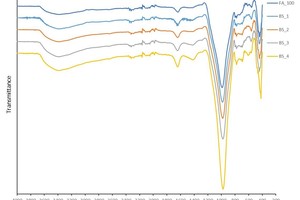
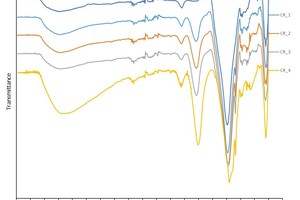
The IR spectra of the brick flour-fly ash geopolymers are shown in » Figure 6. The most important transmission bands are located at the wave numbers 3380, 980 and 440 cm-1. The IR spectra of the concrete rubble-fly ash geopolymers tested are shown in » Figure 7. In this case, the most important transmission bands are located at 3380, 1429, 977 and 449 cm-1.
The wide transmission band at 3400 cm-1, which is detected in all geopolymer systems, can be attributed to the O-H groups of the silanols and the hydrogen bridges between adherent water molecules and the silanols. Also detected in all geopolymer systems is the band at around 1650 cm-1, which is characteristic for water molecules, as bonded to the inorganic geopolymer matrix. Accordingly, these transmission bands that are not present in the starting materials indicate newly formed silanol groups and water molecules integrated in the geopolymers and can be regarded as indicators of the geopolymerization that has taken place [11–13].
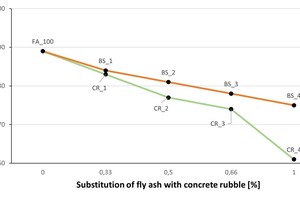
A particularly important band in respect of the geopolymerization of fly ash is that at 1016 cm-1, which the IR spectrum of the brick flour shows at 1012 cm-1 and that of the concrete rubble at 987 cm-1. These are the asymmetrical oscillation bands of the Si-O-Si and Si-O-Al compounds (abbreviated to Si-O-T, where T can stand for Al or Si). In the literature, it is already known that the intensity of this band is proportional to the reactivity of the starting materials [14]. This pronounced band shifts during the geopolymerization of fly ash to lower wave numbers, exactly as the IR spectra investigated here also reflect. This peak shift shows clearly that a reaction has taken place from which a structural change of the material results. The big shift to lower wave numbers can be explained with the exchange of SiO4 tetrahedra with AlO4 tetrahedra in the forming geopolymer network. As a result, the chemical environment of the Si-O bonds changes [15, 2]. If the shift is bigger, it can be assumed that more AlO4 tetrahedra are embedded in the SiO4 basic structure than observed in similar analyses of zeolites [16–19]. This behaviour is explained based on the force constant, which is higher in Si-O than in Al-O bonds. A lower force constant leads correspondingly to lower wave numbers [20]. » Figure 8 shows the bands location of the starting materials fly ash, brick flour and concrete rubble, as well as the peak shift to the increasingly smaller wave numbers of the Si-O-T bond oscillations. The more fly ash substituted with brick flour (BS) or concrete rubble (CR), the more pronounced the peak shift of the Si-O-T bonds to lower wave numbers. This indicates the increasing embedding of Al3+ into the geopolymer network. That would lead to better cross-linking, and accordingly to increasingly high compressive strengths. As the compressive strength, however, reaches its maximum in the geopolymer batches BS_1 (33 wt% brick flour) and CR_2 (50 wt% concrete rubble), at the same time, other effects must play a role.
In the case of the substitution of fly ash with increasing brick flour additions in the geopolymer, it can be assumed that the content of crystalline inert phases increases, which without reacting counter the strength development. If we look at the geopolymers consisting of concrete rubble, the peak shift is even clearer. In this case, too, during the setting process, a second effect must take place parallel. As with the increasing addition of concrete rubble, the calcium content of the mixes is also increased, as described under 1. Introduction, the logical conclusion is that in addition a more poorly cross-linked C-A-S-H gel forms. The less the gel is cross-linked, the stronger the peak shift is in the direction of lower wave numbers [21, 22]. This shows that in both cases a second phase initially improves the strength developed, but, once a certain point is exceeded, it reduces the strength. The difference is that it is an inert in the brick flour, whereas the second phase of the concrete rubble continues to react and forms its own strength. This also explains why the compressive strength of the fly ash-concrete rubble geopolymers considerably exceed those of the fly ash-brick flour geopolymers.
The band of the O-C-O bonds of carbonate compounds is found at 1415 cm-1 in the starting materials brick flour and concrete rubble and between 1450 and 1408 cm-1 in the hardened geopolymers. In the fly ash, no carbonate compounds can be detected. In the case of geopolymer batches CR_1 to CR_4, which contain concrete rubble, calcium carbonates have already been introduced by the starting materials. This is not the case in the pure fly ash geopolymer FA_100 for the above-mentioned reason and only in certain cases in the fly ash-brick flour geopolymers. In accordance with the literature data, it can be assumed that because of the reaction of excess sodium in the activator solution with carbon dioxide in the ambient atmosphere sodium carbonates form, to which this peak development can be attributed [12, 17].
3.2.2. X-ray diffraction analysis
X-ray diffraction analysis (XRD) can be used to establish whether a geopolymerization of the input materials has occurred. During polymerization, a disordered structure is formed in the developing geopolymer matrix in which the atoms are embedded further apart from each other compared to in the input materials [23]. From this results a shift of the X-ray amorphous phase in the direction of higher 2Θ values [24]. Moreover, it is possible to establish how much amorphous phase has formed in the geopolymer batches produced based on qualitative evaluation of an integration of the areas under the X-ray amorphous phases of the respective XRD diagram [38]. In this way, reliable information can be obtained on the increase or decrease in the amorphous phase, without losing signal intensity with the use of a spike material, as in a classical Rietveld analysis. As a result, it is also possible to clarify the mineralogical composition before and after geopolymerization from the same XRD analysis.
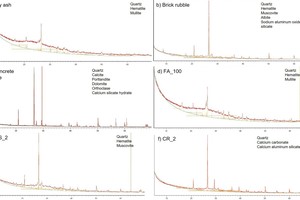
In the work described here, both the input materials fly ash, brick flour and concrete rubble (» Figures 9 a), b) und c)), and the produced geopolymers were analysed by means of XRD. In the further course of the work, by way of example, the XRD analyses of the FA_100 geopolymer batch prepared from pure fly ash and the BS_2 geopolymer batch consisting of a 50:50 mixture of fly ash and brick flour and the CR_2 charge consisting of a 50:50 mix of fly ash and concrete rubble are considered ( Figures 9 d), e) and f)). From the analysis, it can be seen that the X-ray amorphous subsurface of fly ash lies at around 2Θ = 25 °, in the case of the brick flour at around 2Θ = 26 ° and in the case of the concrete rubble at around 2Θ = 27 °. From the comparison of the diffractograms of the input materials and the resulting geopolymer batches, it is shown that for all geopolymers the X-ray amorphous range was shifted considerably, from 2Θ = 25 – 27 ° of the input materials to higher angles between 2Θ = 28 – 30 °. This shift indicates that geopolymerization has taken place, as could be expected from the results of the sections 3.1.1 Compressive strength and 3.2.1 IR Spectroscopy.
From the integral evaluation of the areas under the X-ray amorphous regions of the educts and the products, it is shown that the pure fly ash geopolymer FA_100 has the highest amorphous content. If the waste content of brick flour or concrete rubble is increased, the content of amorphous phase decreases steadily. For the batches containing the brick flour, the suspicion is confirmed that the increased compressive strength of geopolymer batch BS_1 compared to the geopolymer batch FA_100 can be attributed to a particle reinforcement as described in 3.1 Compressive strength. In the case of the geopolymer batches containing concrete rubble, at 2Θ = 29,5 ° the C-S-H phases typical for concrete could be detected [25], which could not be detected either in the fly ash or in in the FA_100 batch. In all geopolymer batches containing concrete rubble, at 2Θ = 29.5 ° one of the reaction products can be identified that is similar to a weakly ordered C-S-H structure. That shows, that besides the N-A-S-H gel detected between 2Θ = 28 – 30 °, at 2Θ = 29.5 ° a C-A-S-H gel is present as a reaction product, as known for alkali-activated slags from the literature [26–29]. With increasing concrete rubble content, the intensity and width of the structure observed at 2Θ = 29.5 ° increases, while the X-ray amorphous area at 2Θ = 28 ° decreases. As a discrete peak attributed to the C-S-H phases is identified at 2Θ = 29.5 °, it can be assumed that parts of this phase are made up of crystalline components. The increase in the peak width in the direction of decreasing intensities and the second amorphous hump indicate that this phase consists partly of amorphous components. This observation confirms the previous assumption under 3.2.1 IR Spectroscopy that N-A-S-H gel and C-A-S-H gel co-exist in the analysed geopolymer batches and with increasing rubble addition, the content of C-A-S-H gel increases while the content of the N-A-S-H gel decreases. The co-existence of the two gel phases has already been proven by means of Magic Angle Spinning Nuclear Magnetic Resonance for alkali-activated mixes of slags and fly ashes [30]. In all geopolymer batches containing concrete, the quartz introduced by the sand and gravel could be detected even after the setting reaction. This shows that the quartz crystals are contained in the geopolymer mixes as almost inert filler without reacting.
3.3. Scanning electron microscopy
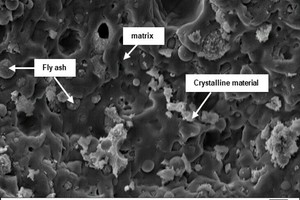
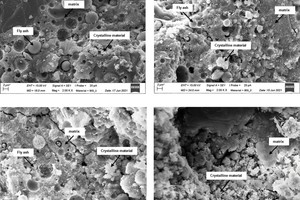
In the further course of the work, analyses were conducted with a scanning electron microscope. » Figures 10 to 12 show SEM images of geopolymer fracture surfaces. » Figure 10 shows the fracture surface of the pure fly ash geopolymer FA_100 with not completely reacted, round fly ash particles, surrounded by matrix material. » Figures 11 a) to d) show the geopolymer fracture surfaces with increasing brick flour content and decreasing fly ash content in the sequence from » Figure 11 a) specimen with 66 wt% fly ash to » Figure 11 d) geopolymer specimen without fly ash, prepared from pure brick flour. From the comparison of the SEM images, it can be seen that with decreasing content of fly ash, the number of non-reacted fly ash particles decreases. In addition, it is evident that with increasing content of brick flour, the number of relatively large, non-reacted crystals in the geopolymer increases. From the literature data, it is known that the non-reacted crystals reduce the compressive strengths of the geopolymers [31], which was similarly observed in this work (3.1 Compressive strength).
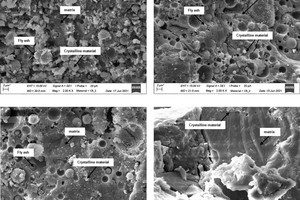
» Figures 12 a) to d) show the geopolymer fracture surfaces with increasing concrete rubble content and decreasing fly ash content in the sequence from » Figure 12 a) specimen with 66 wt% fly ash to » Figure 12 d) geopolymer specimen without fly ash, prepared from pure concrete rubble. From the comparison of the SEM images, it is shown that with decreasing fly ash content, also the number of non-reacted fly ash particles decreases. The pore spaces surrounding the fly ash particles indicate a continuing reaction and gel development after hardening of the binder. The not completely reacted fly ash particles of different size and the surrounding pores indicate an incomplete reaction of the fly ash particles [32].
From the comparison of the SEM images, it can also be seen that with increasing content of concrete rubble, the number of relatively large, non-reacted crystals introduced into the material by the concrete rubble initially increases with the addition of 33 wt%. If the concrete rubble content is increased further to 50 wt% (» Figure 12 b)), in the fracture surface, far fewer large, but more small crystals in-grown into the matrix can be observed. The matrix surface appears rougher than the matrix surface of the geopolymer batch FA_100 in Fig. 10. When the concrete rubble content is increased to 66 wt% (» Figure. 12 c)), the roughness of the fracture surface is also increased. Batch CR_4 consisting of pure concrete rubble exhibits a smooth fracture surface (» Figure 12 d)). These morphological findings confirm the previous results of 3.2.1 IR spectroscopy and 3.2.2 X-ray diffraction analysis indicating that in the case of the concrete rubble batches two different gel phases (N-A-S-H and C-A-S-H) coexist. From the SEM-analysis, it is shown that all geopolymer batches form a continuous matrix phase, be it N-A-S-H, C-A-S-H or a mix, with which the comparatively high compressive strengths in 3.1.1 Compressive strength can be explained.
4. Summary and conclusion
In the work presented, geopolymers were prepared on laboratory scale from fly ash, brick flour, concrete rubble and an alkaline activator solution. The goal of the analyses consisted on the one hand in testing whether the brick flour and ground concrete rubble are basically suitable as matrix materials for geopolymerization, and, on the other hand, what influence increasing additions of waste material have on the setting reaction, the structures formed and the associated material properties of the geopolymers.
All the geopolymer batches with different compositions exhibit compressive strengths suitable for use in the construction industry, including the geopolymer batches prepared from pure brick flour and pure concrete rubble. By means of IR spectroscopy and XRD analysis, the course of a geopolymerization could be clearly identified. This can be established on the one hand based on the shift of and formation of new transmission bands of Al-O, Si-O and O-H units in the comparison of the starting materials with the products formed, which could be detected by means of IR spectroscopy. On the other hand, with XRD analysis, it could be shown that for all compositions used here, amorphous geopolymer phases are formed that can be imaged by means of scanning electron microscopy. From the analysis, it is shown that the brick flour is at least partially dissolved and then takes part in the geopolymer reaction. This means that pure brick flour is in principle suitable as matrix material for geopolymers, which is confirmed by the results for geopolymer batch BS_4 consisting of pure brick flour.
On account of the detected peak shift of certain band locations in the IR spectra, it can be established that with the addition of concrete rubble, with high probability, both N-A-S-H gel and C-A-S-H gel co-exist in the specimens. The highest N-A-S-H gel content is detected in geopolymer batch FA_100 prepared from pure fly ash and the highest C-A-S-H gel content in geopolymer batch CR_4 prepared from pure concrete rubble. This theory could be confirmed by means of XRD analysis with the detection of an amorphous N-A-S-H gel phase between 28 – 30 °2Θ and a partly crystalline, partly amorphous C-A-S-H gel phase at 29.5 °2Θ. By means of integral evaluation of the areas below the amorphous regions of the diffractograms, it could be shown that geopolymer batch FA_100 prepared from pure fly ash mainly forms a N-A-S-H gel phase, which decreases with increasing concrete rubble content while the C-A-S-H gel phase increases simultaneously. Accordingly, the highest C-A-S-H gel content is detected in geopolymer batch CR_4 prepared from pure concrete rubble. This also shows that concrete rubble is at least partially dissolved and then takes part in the geopolymer reaction. This means that pure concrete rubble is also suitable as matrix material for geopolymer production, which is proven by the composition of the geopolymer batch CR_4 consisting of pure concrete rubble.
The substitution of the fly ash content with the waste materials brick flour and concrete rubble leads to major changes in the materials properties of the resulting geopolymers. It is shown that with the substitution of 33 wt% fly ash with brick flour, the compressive strength initially increases to a maximum σd = 87.6 MPa on account of a particle reinforcement. If more fly ash is substituted with brick flour, the compressive strength decreases steadily down to a minimum of σd = 24.3 MPa for a geopolymer prepared from pure brick flour.
If the fly ash content is substituted with concrete rubble, it is assumed that the described coexisting nanoscale structures have a major influence on the material properties. For instance, the FA_100 batch composed of pure fly ash demonstrates thanks to its strongly cross-linked N-A-S-H structure an already relatively high compressive strength of σd = 83.2 MPa. These compressive strengths are clearly exceeded by the additional formation of partly amorphous and partly crystalline, although more poorly cross-linked C-A-S-H structures of the concrete-rubble-containing batches CR_1, CR_2 and CR_3. The highest compressive strengths of σd = 113.2 MPa that could be demonstrated in this work are obtained with the 50:50 mixing ratio of fly ash and concrete rubble in geopolymer batch CR_2. Geopolymer batch CR_4 consisting mainly of less cross-linked C-A-S-H-structures prepared from pure concrete rubble shows, similar to batch BS_4 prepared from pure brick flour, a low compressive strength of σd = 25.65 MPa.
The thermal conductivity of geopolymer FA_100 prepared from pure fly ash is λ10,dr. = 0.354 W m-1K-1. The substitution of 33 wt% fly ash with brick flour leads to an increase in the thermal conductivity to λ10,dr = 0.409 Wm-1K-1. With further increase of the brick flour content, the thermal conductivity decreases proportionally to the decreasing apparent density ρb to a minimum of λ10,dr. = 0.293 Wm-1K-1.
If, on the other hand, the fly ash is substituted with concrete rubble, apparent density and thermal conductivity increase linearly and directly proportionally to each other. Geopolymer batch CR_2 shows the highest apparent density of ρb = 1.80 gcm-3 obtained in this work, with thermal conductivity of λ10,dr. = 0.526 W m-1K-1. This can be explained by the C-A-S-H structure formed in addition to the N-A-S-H structure. With this additional gel phase, the density of the material formed increases, the corresponding thermal conductivity rising accordingly. If the concrete rubble addition is increased further, the apparent density remains on the same level. The highest thermal conductivity of λ10,dr. = 0.608 W m-1K-1 obtained in this work is demonstrated by geopolymer batch CR_3 with 66 wt% concrete rubble content, whereas geopolymer batch CR_4 with 100 wt% concrete rubble ranks just under with λ10,dr. = 0.558 W m-1K-1.
From the research, it is shown that the compressive strength and the thermal conductivity are dependent on the phases formed in the geopolymer and develop differently depending on the composition. With consideration of the results presented here, a property-oriented development of construction material is possible on the basis of fly ash-brick flour-concrete rubble geopolymers with improved properties compared with those of conventional construction materials. On the basis of the results presented, it may be expedient to test various compositions of brick flour and concrete rubble so as to be no longer dependent on fly ash. Only in this way can geopolymer technology continue to be used in future in an economic area dispensing with coal-fired power. It is expedient to press ahead with this development and introduce it on industrial scale both in respect of achieving a future decarbonized construction industry as well as in respect of improving the material properties of geopolymer products compared to those of conventional construction materials.
Acknowledgement
The research leading to these results was funded by the European Union with the LIFE Programme 2014-2020 for Environment and Climate Action under Project Number LIFE18 CCM/ES/001114.

