



“Natural Gas and Hydrogen – What’s New?” Findings from Laboratory and Field Studies (part 3 of 3)



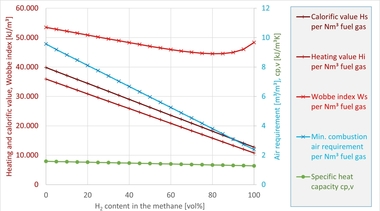
![»24: Calculation results for methane/hydrogen from [5], with the dry exhaust gas volume and the calculated fluorine content in the dry exhaust gas](https://www.zi-online.info/imgs/2/3/9/7/5/5/2/Bild_24_-_Berechnungsergebnisse_Erdgas-Wasserstoff_aus__5___ergaenzt-4200715af590aa1c.jpeg)


4.4.4 Composition of the exhaust gas
4.4.4.1 Emissions from the raw material
Besides containing the combustion products of the fuel gases, the exhaust gas also consists of the emissions from the unfired raw material. These were calculated based on the composition of the raw material and are shown in »Table 7.
For a total setting mass of 51.8 kg, the following gas masses are expected from the raw material:
3.36 kg steam
7.38 kg CO2
approx. 0.006 kg NO
approx. 0.5 kg SO2
For calculation of the NO mass, twice the TOC content was taken to be the wood mass with 0.1 mass% nitrogen in the wood content (cf. [7], [9] and authors’ own measured values). The nitrogen content and therefore the NO mass as well as the pyrite content and therefore the SO2 mass are merely approximated values.
4.4.4.2 O2 and CO2 concentration for the hydrogen firing
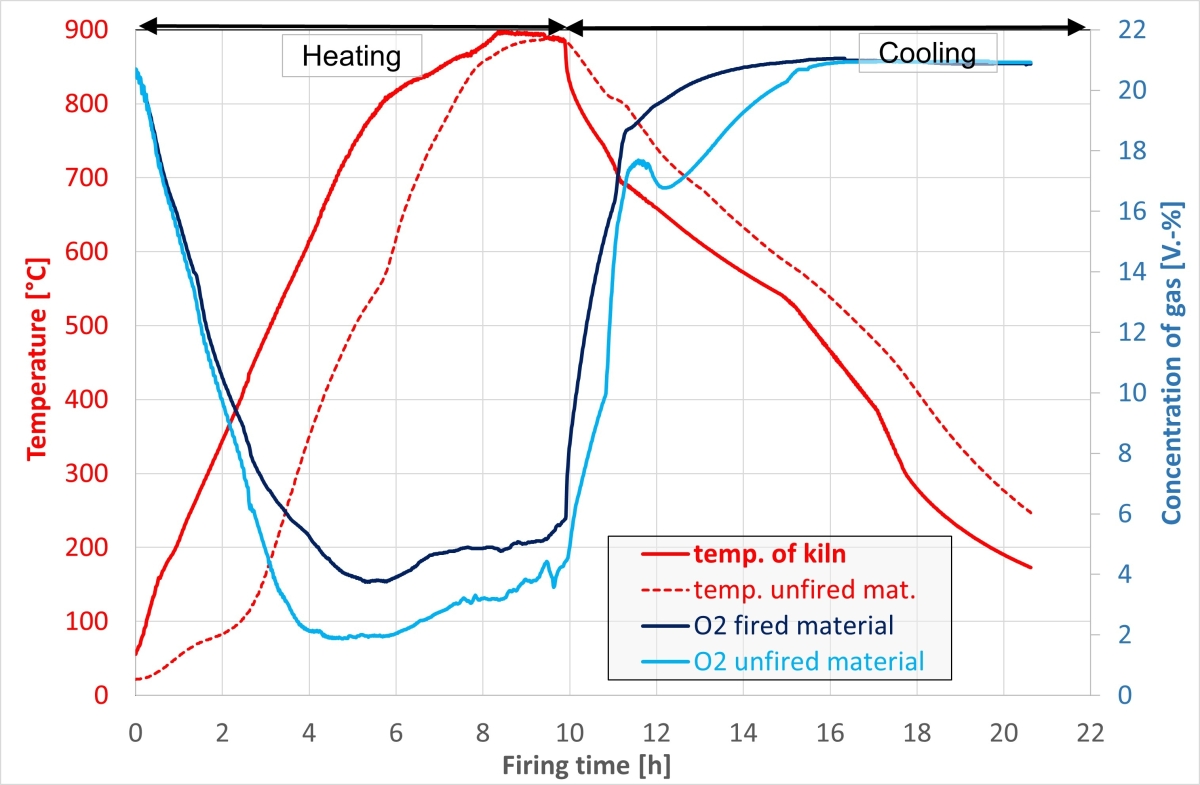
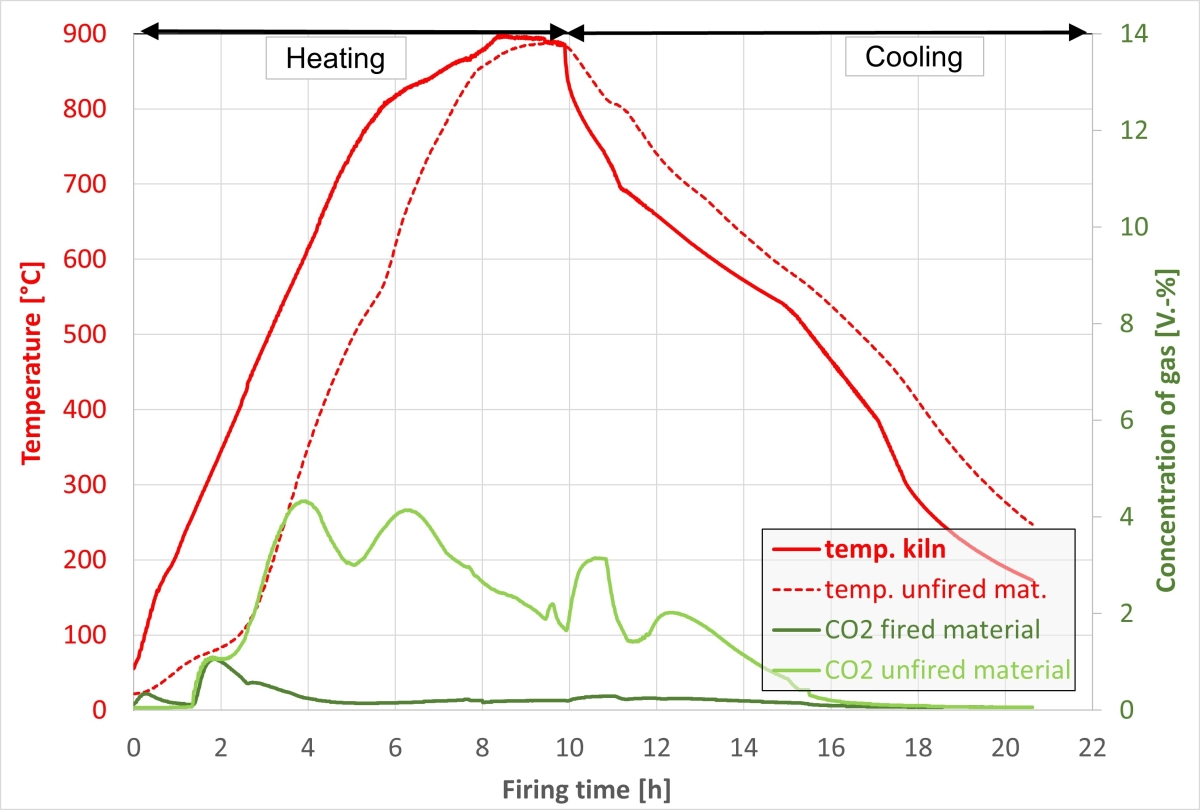
The oxygen (O2) and carbon dioxide (CO2) contents measured in the exhaust gas for the firing with hydrogen are shown in »18 und »19.
On the left in the figures, the O2 and CO2 contents are shown in each case as a function of the firing time. On the right in the figures, the same measured values are shown, however, as a function of the material temperature. In this connection, it should be noted that the pure CO2 emissions from the unfired raw material can only be seen in the case of the hydrogen firing as here these are not superposed by the combustion products of the fuel gas. The O2 content, on the other hand, comes from both the material reactions and the combustion of the fuel gases.
For the fired material, both during heating and cooling, no CO2 emissions caused by material reactions could be detected. The increase up to 250 °C is caused by activation of the thermal afterburning system (TAS), which is heated with natural gas. During heating-up of the kiln, the exhaust gases of the TAS radiate into the firing chamber so long until the flue has built up a sufficient draught and the exhaust gases from the TAS are transported to the flue.
Heating
The O2 content in the exhaust gas is shown in »18. It decreases with increasing temperature as a result of the combustion of the fuel gas. In the case of the unfired material, it decreases faster than for the fired material as additional oxygen is consumed by the burnout of the organic components it contains. From a kiln temperature of 800 °C, the O2 content increases slightly, which is attributed to the stronger firing pulses of the burners with increasing temperature. In this process, the kiln is additionally supplied with combustion air. This phenomenon occurs both in the case of the unfired and the fired material.
The CO2 content in the exhaust gas is shown in »19. From a temperature of 130 °C in the unfired material, the CO2 content increases on account of the oxidation of the organic components. The values reach a maximum at 334 °C and a minimum at 501 °C. From here, the oxidation of the residual carbon and the deacidification of the carbonates are superposed. The maximum is reached at 670 °C. After that, the CO2 content decreases up to the maximum firing temperature. The reactions described can be seen in the material gradients in »16 (right), see ZI 3/26, page 16, in the same temperature ranges.
Cooling
The kiln initially cools passively as a result of temperature differences and leakages. The unfired material cools somewhat more slowly than the fired material. In the case of the unfired material, therefore, already from a kiln temperature of 750 °C, combustion air is actively blown into the kiln, whereas for the fired material this is only done from 720 °C (cf. »18 left). For the unfired material, this active cooling between 819 and 723 °C material temperature led first to a rapid increase in the O2 content, while at the same time reducing the CO2 content as a result of the dilution of the exhaust gas with air (cf. »18 and »19 rght). On account of the increase of the O2 content in the kiln, shortly after the residual carbon was burnt out. At this point, the material temperature and the CO2 content increased, while the O2 content decreased. The passive and active cooling can also be seen in the case of the fired material. Here, however, the material does not react with the atmospheric oxygen.
4.4.4.3 O2 and CO2 concentration for the natural gas firing
The measured O2 and CO2 contents in the exhaust gas for the firing with natural gas are shown in »20 and »21.
In the figures on the left, the O2 and CO2 contents are shown as a function of the firing time. The figures on the right show the same measured values, however, as a function of the material temperature. It should be noted that both the material reactions and the combustion of the natural gas are reflected in the O2 and CO2 contents. For both O2 and the CO2 therefore, the switching point of the burner output and the lambda value is always shown at a kiln temperature of 430 °C (left). An additional figure as a function of the kiln temperature has not been included for the sake of clarity.
For the fired material, during heating only the CO2 emissions of the natural gas combustion can be registered, which during cooling are increasingly diluted with the cooling air.
Heating
The O2 content in the exhaust gas is shown in »20. It decreases with increasing temperature as a result of the combustion of the fuel gas. In the case of the unfired material, it decreases faster than for the fired material as additional oxygen is consumed by the burnout of the organic components. From a kiln temperature of 800 °C, the O2 content increases slightly, which can be attributed to the stronger pulsing of the burners with increasing temperature. In this process, additional combustion air gets into the kiln. This phenomenon occurs both in the case of the unfired and fired material.
The CO2 content in the exhaust gas is shown in »21. From a temperature of 100 °C in the unfired material, the CO2 content increases as a result of the oxidation of the organic components. The values reach two maxima at 369 and 606 °C and a minimum at 496 °C. From 496 °C, oxidation of the residual carbon and deacidification of the carbonates are superposed. The maximum is reached at 606 °C. After this, the CO2 content decreases up to the maximum firing temperature. The reactions described can be identified in the material gradients in »16 (right), see ZI 3/26, page 16, in the same temperature ranges.
Cooling
Here, too, the kiln cools initially passively as a result of temperature differences and leakages. The unfired material cools somewhat more slowly than the fired material. In the case of the unfired material, therefore, already from a kiln temperature of 750 °C combustion air was actively injected into the kiln, whereas for the fired material this was only done from 720 °C, (cf. »20 left). This active cooling between 826 and 731 °C material temperature led in the case of the unfired material first to a rapid increase in the O2 content, while at the same time reducing the CO2 content as a result of the dilution of the exhaust gas with air (cf. »20 and »21 right). On account of the increase of the O2 content in the kiln, shortly after the residual carbon was burnt out. In this process, the material temperature and the CO2 content increased, the O2 content decreased. The passive and active cooling can also be seen for the fired material. Here, however, the material does not react with the atmospheric oxygen.
Hydrogen – natural gas comparison
In both hydrogen firings, the switching point of the burner output at 430 °C could not be identified in either the O2 or the CO2 content, in the case of the natural gas, on the other hand, it could be clearly seen.
For hydrogen, the O2 content falls during heating up to a kiln temperature of 500 °C more slowly than with the natural gas; for hydrogen, the O2 content in the kiln is always 1 to 2 vol% higher than with natural gas. Both circumstances are attributed to the fact that in the case of hydrogen less energy is needed in the form of fuel, which is why the burners cycle more frequently than with natural gas. During the cycling, before the actual combustion, the burner head is always purged with air. As a result, additional oxygen gets into the kiln.
Both in the case of hydrogen and natural gas, the CO2 content shows the described maxima and minima at the same kiln temperatures.
The CO2 masses calculated from the fuel volume and the raw material along with the CO2 masses measured for each firing are shown in »Table 8. To this end, the CO2 masses were calculated or measured from the natural gas consumption of the kiln and TAS and calculated from the raw material. The individual values are shown in lines 1 to 3 and totalled in line 4. Line 5 shows the measured values for comparison.
The first line details the CO2 masses calculated from the measured natural gas consumption of the kiln and the CO2 mass for each Nm³ natural gas (cf. »Table 3, in Part 2, ZI 3/26, p. 8). The values are dependent on the fuel gas consumption. The value is smaller for the unfired material than for the fired material, as the unfired material introduces energy into the kiln and reduces the natural gas consumption. For hydrogen, this calculation is not applicable.
The second line shows the measured CO2 mass for the hydrogen firing at the fired material (cf. last line). The measured value comes solely from the natural gas combustion of the TAS. For the natural gas firings, the content of the CO2 from the TAS is presumed to be slightly higher as the TAS was already activated at 200 °C. However, this could not be verified on the basis of the measured results.
In the third line, the calculated CO2 mass from the unfired raw material is specified (cf. »Table 7). The fourth line totals Lines 1 to 3.
For comparison, the last line shows the CO2 masses measured with the exhaust gas analysis and relative to the volume of the exhaust gas (cf. 4.4.2). The measured values are made up of the CO2 from the natural gas consumption of the kiln and the TAS as well as from the unfired raw material. It can be seen that the measured CO2 mass for hydrogen and the unfired material corresponds almost to the emission from the raw material. The values of the natural gas firings of the fired and unfired material also lie in the same order of magnitude. The calculated values, on the other hand, are slightly higher than the measured values.
4.4.4.4. NOx concentration in the hydrogen and natural gas firing
Nitrogen oxides can form in a combustion process both thermally as well as promptly and from the fuel. Thermal nitrogen oxides are formed at high temperatures from the N2 and O2 content of the combustion air. Prompt nitrogen oxides form in the presence of CH radicals and air, fuel nitrogen oxides from the chemically bound nitrogen in the fuel, e.g. from amino acids and proteins in the wood [9].
During the firings, the contents of NO2 and NO in the exhaust gas were measured. The NO2 content amounted to less than 10 ppm both in the case of hydrogen and natural gas for both the unfired and fired material. This was expected as experience has shown approx. 5 % NO2 and approx. 95 % NO are formed during a combustion [10], [11].
The measured NO contents were dependent on both the fuel gas and the material and are shown in »22 and »23 as a function of the firing time.
It has been shown that with the fired material and steep temperature increase, the NO content steadily increases. The switching point of the burner output at 430 °C kiln temperature leads to a NO reduction. Here, more combustion air gets into the kiln and dilutes the exhaust gas. From around 800 °C, the temperature increases less steeply and the NO content remains almost constant. From this point in time, less fuel gas is needed for heating and burned. In addition, the O2 content increases as a result of the higher content of combustion air and leads to the dilution of the exhaust gas. The measurement curves do not indicate any material influence. The increase can be attributed solely to the formation of thermal NO at the burner. During cooling, between 720 and 695 °C, the addition of cooling air can be identified to a minor extent, as this dilutes the exhaust gas and therefore reduces the NO content.
For the unfired material, during the steep temperature increase in the kiln, first a considerable increase in the NO content can be registered, which in turn plateaus after six hours. The kiln temperature is still low so that less thermal NO is formed. It is assumed that the two peaks with a maximum at 546 °C kiln temperature come from the nitrogen contained in the papermaking waste. It is known that nitrogen from proteins and amino acids present in wood escapes between 130 and 350 °C [9]. From 750 °C, the NO emissions stagnate. Here, the material introduces additional energy into the kiln. Consequently, a lower burner output is required, which is reduced more steeply from 800 °C than for the fired material. In addition, the O2 content in the exhaust gas increases slightly from a kiln temperature of 800 °C and therefore reduces the NO emissions. From 800 °C, the NO content increases again, similar to the increase observed for the fired material. Here, presumably, the thermal NO forms independent of the raw material. During cooling, between 750 and 695 °C, the addition of cooling air to the cooling of the setting can be seen as a result of the afterburning of the residual carbon, as this dilutes the exhaust gas and therefore reduces the NO content.
The NO masses calculated from the raw material as well as the measured NO masses for each firing is shown in »Table 9. The NO content from the wood contained in the papermaking waste was calculated as 6.3 g (cf. »Table 7).
The NO masses expected from the raw material are shown in the first line. They are superposed by the thermal NO, which is dependent on the fuel and the combustion temperature. The fired material additionally requires higher energy input than the unfired material. Here, more thermal NO is formed. Both for hydrogen and natural gas, the measured values are higher than those calculated from the raw material.
In the case of hydrogen, for the fired material, more NO was measured than for the unfired material. In addition, the NO masses are somewhat higher than for the natural gas.
In the case of natural gas, the measured NO masses were almost the same for the fired and unfired material. It is assumed that during combustion, not the entire organic nitrogen from the raw material is converted into nitrogen oxides. A part of it can react to molecular nitrogen or be bound into the ash [9].
4.5 Steam and pollutants in the exhaust gas as a function of the H2 content in the natural gas
4.5.1 Basic principles – hydrogen/natural gas mixes
In a thermal process, a certain amount of energy is always needed to obtain the same fired results. For this reason, in a comparison of fuel gases with different calorific values, it appears helpful to correlate all gas properties with their respective calorific value and to compare these energy-specific values with each other. In [5], key data for methane (CH4), hydrogen (H2) and their mixes have already been presented as a function of the H2 content in the CH4. As a key component in natural gas, CH4 was selected for the sake of simplification. Here, it was shown that besides the fuel gas requirement in Nm³/MJ, also the CO2 emissions in kg/MJ are reduced in a non-linear relationship with the H2 content in the CH4. For instance, the CO2 emissions are halved only at a H2 content of around 80 vol% in the CH4.
The non-linearity of the CO2 emissions relative to the calorific value as a function of the H2 content in the CH4 results from the arithmetic operation 1/x. With different value pairs or H2 contents in the CH4, a hyperbola is formed. For this reason, for example, the operation 1/Hi (reciprocal calorific value = required fuel gas volume per megajoule) also forms a hyperbola, in which the fuel gas volume increases disproportionately with increasing H2 volume in the CH4.
As a further calculation step, the properties of the CH4/H2 mixes were correlated with the respective value for 100 % CH4. From this results a relative change of the respective property of the gas mix compared to CH4. On the basis on the curves in »24, the relative change caused by the H2 compared to CH4 can be determined as a percentage.
4.5.2 CO2 and NO emissions
The non-linear curve for steam and CO2 as a function of the H2 content in the natural gas could be confirmed with the measurement of the exhaust gas composition at the chamber kiln for the fuel gas mix with 50 vol% hydrogen in the natural gas. »25 shows the measured CO2 and NO contents in the exhaust gas for the firings of the fired material with the pure fuel gases and the fuel gas mix.
The CO2 measured values for natural gas (brown) and the fuel gas mix (green) show that the CO2 content for the fuel gas mix is not halved but only reduced by about a quarter. The increase in the CO2 content for the firing with 100 % hydrogen after around 1.4 hours (blue) can be attributed to the activation of the TAS system. As the draught in the flue was not sufficient, a part of the exhaust gas from the TAS, which is heated with natural gas, flowed into the kiln. The NO measured values for the fuel gas mix lie approximately between the measured values for the pure fuel gases. The results are summarized in »Table 10.
The measured steam volume totalled for the combustion of pure hydrogen 1.63 times and for the fuel gas mix 1.15 times that for the natural gas. In addition, for hydrogen, the CO2 content in the exhaust gas decreased to almost 0 kg, while for the fuel gas mix it decreased to just 76 % (cf. »25). These values almost agree with the calculated values from [5] and [6].
The measured NO emissions depend not only on the flame temperature of the fuel gas but also on the specific burner set-up and cannot be calculated in advance. The measured values show, however, that for the fuel gas mix the NO emissions are around half the value for pure hydrogen.
4.5.3 Fluorine emissions
Emissions are formed on the one hand as a result of the combustion of the fuel gas, while, on the other hand, they are caused by the raw materials. So the question was whether in the case of the raw-material-derived emissions like sulphur, fluorine or chlorine, a non-linear curve can also be expected as a function of the H2 content in the CH4. For this reason, the curve was calculated by way of example for a raw-material-derived fluorine content in the exhaust gas and assumed that the fluorine mass flows emitted from the raw material reach the same value for the combustion of natural gas, hydrogen and their mixes. This assumption results from the fact that up to now no measured data on the raw-materials-derived fluorine emissions are known for the use of the two fuel gases.
The fluorine concentration is specified in TA-Luft – Germany’s Technical Instructions on Air Quality Control – as the mass concentration of hydrogen fluoride (HF) per standard cubic metre of dry exhaust gas or as a mass flow. The limits for the ceramic firing process are 5 mg/Nm³ or 15 g/h HF for a reference oxygen content of 17 vol%. No differentiation is made between large and small plants [12].
To show how the HF content changes as a function of the H2 content in the CH4, the results from [5] were supplemented with an assumed HF mass concentration of 5 mg/Nm³ dry exhaust gas for the use of CH4 (cf. »24). The results show that the HF content in the dry exhaust gas also exhibits non-linear behaviour for the same energy input with increasing H2 content in the CH4. For 100 % hydrogen, the HF content in the dry exhaust gas increases by 36 % in comparison to CH4, for 50 % H2 content, on the other hand, with 7 %, by less than a quarter. Only at an 80 % content of H2 in the CH4 does the HF content increase by a half compared with natural gas. While for the relatively large and small reference oxygen contents, the absolute HF contents in the exhaust gas are diluted or concentrated, the shown relative HF contents are independent of both the reference oxygen content and the actual HF mass concentration.
Both the calculation results and the results measured at the chamber kiln showed that for the same energy input, the exhaust gas volume decreases in the case of hydrogen combustion. In comparison to methane, the reduction amounts to 26 % for dry exhaust gas 26 % and 9 % for wet exhaust gas (cf. »Table 4, in Part 2, ZI 3/26, p. 12). As a result of the lower exhaust gas volume, the percental fluorine content in the exhaust gas increases for hydrogen combustion despite a constant fluorine mass flow from the raw material for both fuel gases. That means that despite the same level of emitted fluorine mass flow per unit of time, the volume-specific HF content in the exhaust gas increases.
At present, in brick plants in Germany, the mass concentration of HF in the dry exhaust gas is mostly determined in mg/Nm³ and compared with the limit of 5 mg/Nm³ specified in the TA-Luft regulation. With the use of hydrogen as a fuel gas, on account of the lower exhaust gas volume, it seems expedient to additionally include the dry exhaust gas volume in Nm³/h in the evaluation of the real emissions. For evaluation of the HF content in the exhaust gas, it is therefore recommended to use the mass-flow-specific limit of 15 g/h.
How far the use of hydrogen as a fuel gas influences the raw-materials-related expulsion of fluorine and other pollutants could be shown in future investigations.
5 Conclusion and outlook
In this project, the properties of porosified perforated masonry bricks (HMz) that had been fired both in a tunnel kiln with natural gas and in a chamber kiln with natural gas and hydrogen were compared. It was established that the bricks fired with hydrogen in some cases exhibited slightly higher strengths than those fired with natural gas or were more densely sintered. Feasible as a result is a corresponding reduction in the firing temperature. In general, however, hydrogen had no significant influence on the fired properties of the studied HMz bricks and can be readily used for firing as a substitute for natural gas. This statement applies, however, exclusively for the material studied and the firing curve used. Before any introduction of hydrogen in field practice, the properties of the raw materials should therefore be tested with the help of laboratory analyses.
In the gas-heated chamber kiln, with the help of the continuous exhaust gas analysis and recording of the fuel gas consumption, the main material transformations could be detected. The hitherto theoretical values on the exhaust gas, fuel gas and combustion air volumes as well as on the energy consumption of hydrogen compared to natural gas were confirmed with the measurements. For instance, during firing with hydrogen, energy consumption decreased by 7 to 9 % and the exhaust gas volume to 90 to 91 % on account of the reduced quantity of combustion air of 83 to 84 %.
It was additionally shown that the emissions of pollutants from the raw material increase non-linearly with increasing hydrogen content in the methane on account of the reduction of the exhaust gas volume. For this reason, in future, the absolute pollutant content in the exhaust gas should be determined.
It can therefore be seen that natural gas can be partly or completely substituted by hydrogen – providing sufficient green hydrogen is available at all times and at reasonable cost. Hydrogen is currently too expensive compared to natural gas and not available in the volumes required for brick plants.
The project was funded by Germany’s Federal Ministry for Economic Affairs and Climate Action under the reference number “I2322F002_KlimaZiegProd”.